|
|
|
The Graph of the Fluctuating Flow
 A graph has been drawn up based on the outcome of the video data analysis process. This graph is a visual representation of the 38 episodes (23 minutes) on a scale of percentage.
Four data sequences have been entered on this graph, using the following colour coding: -Concerned with teaching skills/safety to individual participant(s): dark blue -Concerned with setting challenge to individual participant(s): red -Concerned with organising logistics: green -Concerned with other matters: light blue The alternating trend of teaching skills and setting challenge (dark blue and red lines) is clearly visible on the simplified graph below. During most episodes, the level of engagement with these two tasks of facilitation alternate; when one is rising, the other is declining and vice versa. However, during a number of episodes, due to clearly identifiable reasons, the trend is divergent. At these times, both trends are moving together at the same time either on the rise or the decline. The actual "trend breakers" are Episodes 1, 2, 27 and 34, 36 and 37. During most of the episodes, the visible trend is clearly indicating the actual relationship between teaching skills and setting challenges. When the project 'flows', teaching skills and setting challenges are continuously adjusted and addressed alternatively, bringing into focus one against the other from one situation to the next. The Simplified Graph The simplified graph describes the facilitator's engagement with teaching skills (dark blue) and setting challenges (red). A (mostly) alternating trend is visible on this graph. Episodes displaying divergent trend are 1, 2, 27, 34, 36 and 37. 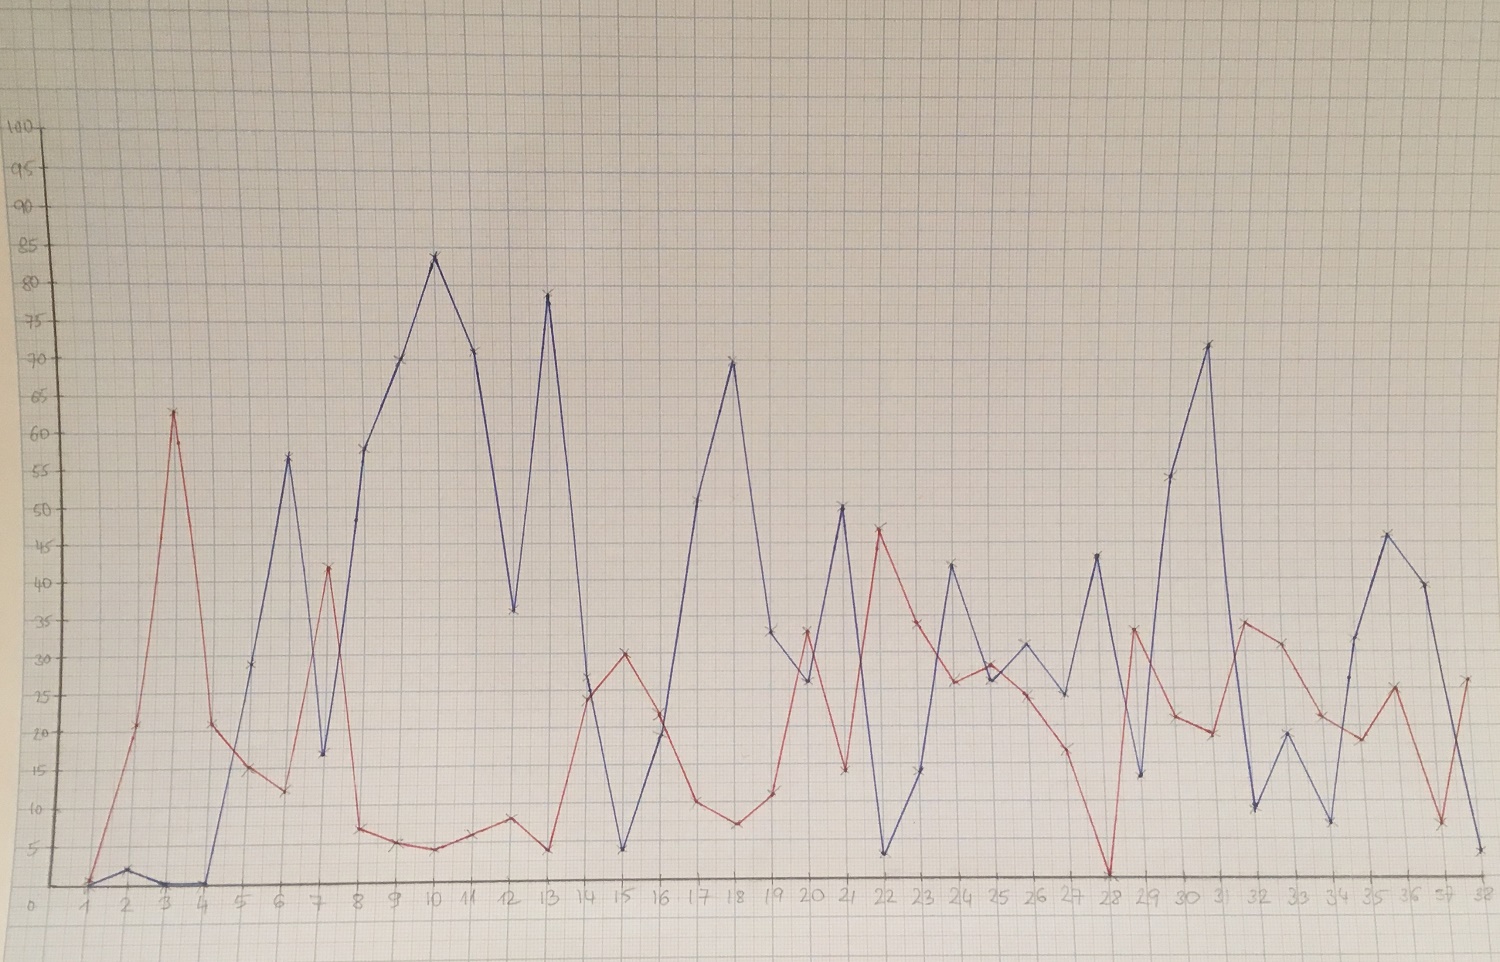
|